
Leadgeneratie
How do you keep your pipeline full when ad spend is cut in half?

Copy for AI
When ad spend is cut in half, you first cut what doesn’t produce deals.
Protect your brand campaigns, keywords with high purchase intent and the campaigns that deliver customers in your CRM.
Show the CFO what a won customer costs per channel.
Put the freed-up budget into your own content and SEO, and judge that after eight weeks.
The verdict: halving ad spend doesn’t have to halve your pipeline, unless you cut every campaign by the same amount.
The CFO’s email is short: half as much for advertising next quarter.
You know sales relies on those inbound requests.
This is the playbook for that week, as part of our guide to reducing your dependence on Google Ads. A pipeline that doesn’t stall when the media budget drops is what B2B lead generation is all about for us.
Which channels do you cut first when you need to reduce ad spend?
Cut by proof, not by percentage.
The reason is price. A median click in Benelux software categories costs about 22 dollars, across 106 search terms we pulled from Google Ads data on 28 September 2026.
For example, a click on “helpdesk software” in the Netherlands costs 146 dollars.
At prices like that, every click that isn’t a buyer counts.
Here’s how far apart those clicks sit:
What do you protect, and what do you cut?
Sort every campaign into one of three buckets: protect, cut or pause. This table does the sorting:
| Campaign | What you do | Why |
|---|---|---|
| Brand campaigns on your own name | Protect | Cheap, and anyone searching your name wants you. Drop them and a competitor takes that click. |
| Keywords with high purchase intent (“[category] software pricing”, “alternative to [competitor]“) | Protect, adjust the bid | Closest to a demo or a quote |
| Campaigns that deliver won deals in your CRM | Protect | The only proof that counts |
| Broad keywords and informational queries (“what is …”) | Cut, take over with content | They attract researchers, an article captures them with no cost per click |
| Performance Max and Display without CRM proof | Scale back hard | Lots of form fills, few opportunities |
| Remarketing | Limit to visitors of pricing and demo pages | The rest is repetition without intent |
| Markets or languages where sales doesn’t follow up | Pause | Leads nobody follows up on |
Rule of thumb: if a campaign can’t point to a won deal, it’s the first to go.
How do you check your brand campaigns?
Brand terms are the cheapest clicks in your account. You can see how much demand they carry in Search Console, by filtering on queries that contain your name:
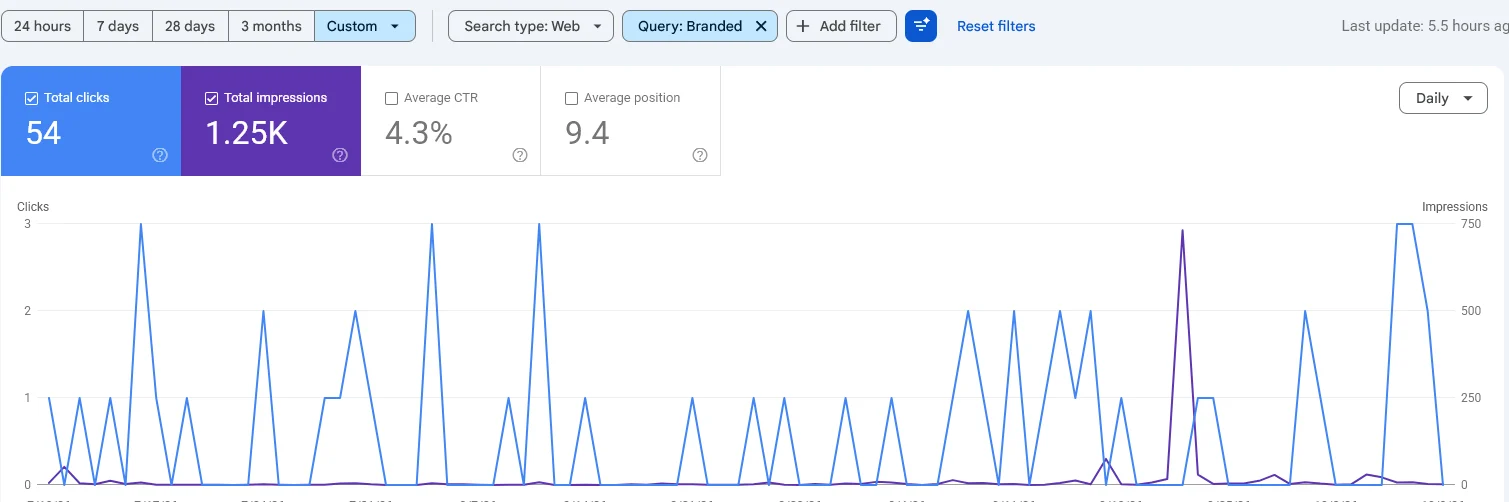 Our own branded queries in Search Console, 10 July to 9 October 2026: 1.25K impressions and 54 clicks.
Those are people who already know you. Keep catching them.
Unsure about your brand terms? Read how to split brand and non-brand keywords.
Want to trim your account without an imposed saving? Read how to reduce your Google Ads costs.
Where does Performance Max fit?
Performance Max often looks good on form fills and weak in the CRM.
Scale it back until it can show opportunities, not leads.
How the campaign type works, and where its budget goes, is covered in our guide to Performance Max campaigns.
The same logic applies to B2B remarketing: keep the pricing-page audience, drop the rest.
Google’s English help page adds that the Learning label itself never lasts more than 7 days.
It also tells you to judge a change over 2 conversion cycles or 2 weeks, whichever is longer.
Does half the budget mean half the reach?
No. Halving doesn’t have to mean reaching fewer people.
At Suivo we achieved 31% more reach in 2025 than a full year earlier, with half the media budget. Cost per lead fell by 61%.
If you’re still deciding what to stop, read when to pause Google Ads and check where budget leaks through wasted spend.
That result came from sharper structure and targeting, not from switching everything off.
How do you show the CFO what a won customer costs per channel?
Show cost per customer, not cost per lead.
That’s the number a CFO decides on.
A cheap lead that never becomes a customer is the most expensive lead in your report.
So build one table per channel:
| Metric | How you calculate it |
|---|---|
| Cost per channel | Media budget plus management and production for that channel |
| Won customers per channel | From your CRM, based on the deal’s first source |
| Cost per won customer | Cost per channel divided by won customers |
| Payback period | Cost per won customer divided by monthly gross margin per customer |
That last line is your CAC payback.
Read how to calculate the CAC payback period, or work it out right away with the CAC calculator.
Where do the won customers come from?
From your CRM, not from Google Ads.
A deal only counts once it’s closed.
HubSpot’s default lifecycle stages make that line visible.
It defines an opportunity as a contact “associated with a deal” and a customer as one “with at least one closed deal”, in its lifecycle stage documentation.
Here are those stages, from lead to customer:
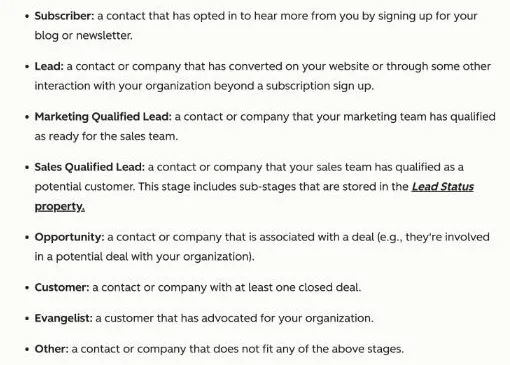 HubSpot’s lifecycle stage definitions, screenshot October 2026.
Count channels at the customer stage.
Everything above it is a forecast.
If your deals aren’t yet tracked by source in your CRM, first read how to import offline conversions.
Watch out: Google matches those imports through the Google Click ID (GCLID) it assigns to every ad click.
Its offline conversion imports page also recommends enhanced conversions for leads as the starting point.
Which conversions should steer the bidding?
Only the ones close to revenue.
In Google Ads, the actions marked Primary are the ones the bidding chases:
 The All conversions list in our own Google Ads account, October 2026. Only actions marked Primary steer the bidding.
If that column holds downloads and page views, half your budget chases the wrong thing.
How big can the gap between channels be?
Bigger than most boards expect.
We saw it at Kaizo.
In September 2025, organic traffic converted to key events 38 times better than paid traffic: 4.6% versus 0.12%.
Want the full picture per stage? Read our guide to cost per opportunity.
A lead is a promise. A deal is proof.
What do you build with the budget that frees up?
Build channels that keep working when you stop paying. That’s where the money from broad clicks goes:
- SEO pages on the expensive keywords you cut. Every term you take out of Google Ads gets a page that aims to rank for it organically. See SEO for SaaS and our SEO programme.
- Content on your buyers’ questions. New pages get a larger share of their impressions from long queries of 7 words or more. Hedgehog reaches 19% versus 10% for older pages, Kaizo 16% versus 10%.
- Visibility in AI answers. At Hedgehog Company, the article was cited as a source in 23 of the 31 AI Overviews on its own question, while the articles were less than two months old. Read what we do as a GEO agency.
Our experience: when paid gets too expensive or the budget gets too small, SEO takes over the inflow.
The goal is a compounding machine that makes you less dependent on paid channels.
How do you choose between a click and an article?
Compare the price of the click with the price of a page.
In the click-or-article calculator, you put the two side by side per keyword.
For example, at Hedgehog Company, a click on “carbon accounting software” in the UK costs about 72 dollars.
A page that ranks for that term earns clicks you no longer pay for.
How the two channels work together is covered in combining SEO and Google Ads.
Bridge first. Switch off later.
How do you explain to a board why SEO pays off later than ads?
Show the curve in advance, so nobody panics in week three.
In our Search Console data from six sites, new content pages follow a fixed pattern:
| Period | What you see | What you do |
|---|---|---|
| Week 1 | Peak: Google tests the page | Don’t celebrate |
| Weeks 2 to 8 | Dip, often below the week 1 level | Don’t cut, keep building |
| From week 9 | Breakthrough | Evaluate now |
Here’s the same pattern as a picture:
On customerimpact.be, the level from week 9 onwards was about three times higher than in weeks 2 to 8.
At Kaizo, from week 10 there were about 90% more impressions than at the low point.
Not every site shows it: one of the six stayed flat.
Read more about the timeline in how long SEO takes, and weigh the two channels in SEO vs Google Ads.
So judge new content after eight weeks, not after two.
Which numbers do you report every month?
Report the same five numbers every month, so the board sees a trend instead of a snapshot:
- Cost per won customer per channel, paid and organic side by side.
- Pipeline per channel: number of opportunities and their value.
- Share of pipeline from owned channels, so you can see dependence falling.
- Organic impressions and clicks on the keywords you took out of Google Ads.
- CAC payback, per quarter.
Where do you read organic impressions and clicks?
In the Search Console Performance report.
Google defines a click there as “the number of times a user clicked your site from Google Search results”, in its Performance report help page.
This is what that report looks like for our own site:
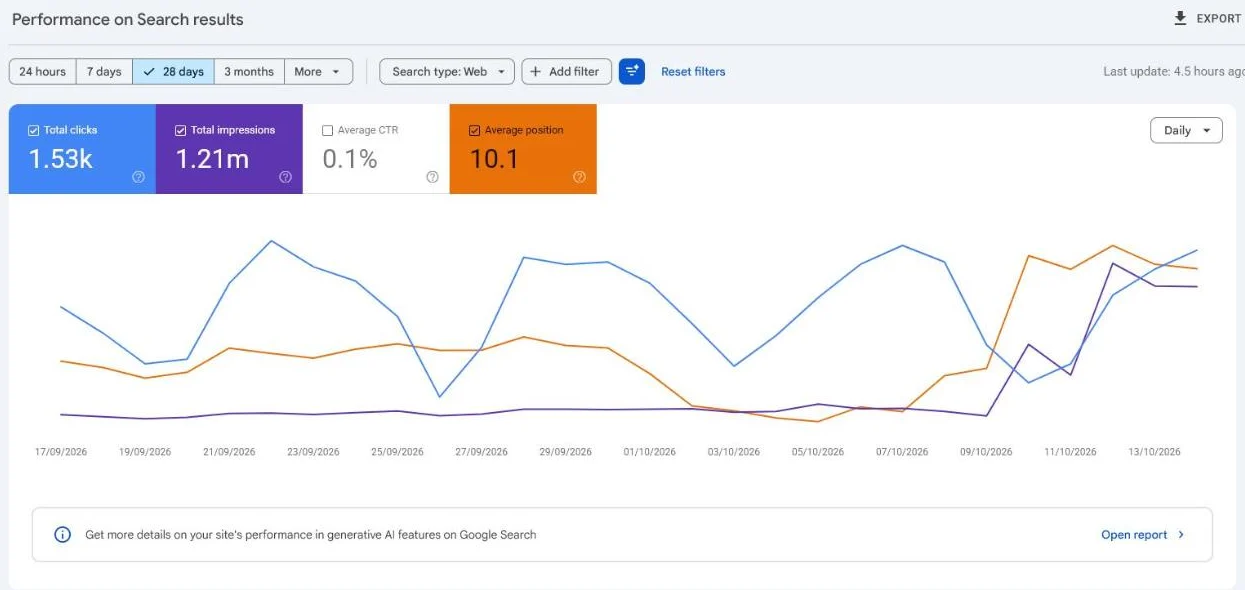 Our own Search Console for customerimpact.be, last 28 days, October 2026. 1.21M impressions against 1.53K clicks.
Filter that report on the keywords you cut from Google Ads.
That line shows the takeover.
What if click and deal are months apart?
Then attribution gets harder.
Long sales cycles put months between the first click and the signed deal.
In that case, read how to measure attribution in long B2B sales cycles.
For the value side, pipeline value shows how to put a number on open opportunities.
Same five numbers, every month.
When we’re not the right choice
If you need new pipeline within six weeks, content isn’t the answer.
First make your existing Google Ads more efficient.
Price: our Google Ads management starts from 950 euros per month for one channel, separate from your media budget.
Budget floor: if your lead generation budget is below 3,750 euros per month, you’ll get more out of improving your best service pages yourself.
Webshops: if you sell through a webshop on ROAS, an e-commerce specialist is a better fit.
We’d rather say so up front.
Frequently asked questions
Our ad budget is being cut next quarter. How do we absorb that?
Start now, not next quarter. Build pages this month on your most expensive keywords with purchase intent, so they’re through their dip when the budget goes away.
Keep your brand campaigns until last: they’re cheap and protect your name.
How do you keep getting leads with half the budget?
By cutting the half that doesn’t produce customers, not half of every campaign. If you cut based on CRM data, you often lose fewer leads than the budget would suggest.
The freed-up money goes to owned channels.
How do you defend a content budget to a CFO who only thinks in months?
Speak their language: cost per won customer and payback period. Show the curve of new pages in advance and agree on a review point after eight weeks.
An article keeps bringing in clicks without you paying per click.
Which marketing efficiency numbers do you show investors?
CAC payback, cost per won customer per channel and the share of pipeline from owned channels. Those three show whether your growth is affordable and depends less on rented reach.
Your next step
Sort your campaigns into protect, cut and pause before the new quarter starts.
Check what your remaining budget buys with the Google Ads budget calculator.
Want a second pair of eyes? Send us your account and we’ll mark what to keep.
Free website scan
Enter your website and get an automatic scan within minutes, with concrete technical and SEO improvements. No sales pitch.
We only use your details for your scan. No spam, unsubscribe anytime.