
SEO & GEO
How to Build an AI Visibility Report for Your Brand

Copy for AI
Want to build an AI visibility report for your brand? In short: you build a report that shows how often your brand is cited in the AI answers of ChatGPT, Perplexity and Gemini, which pages earn those citations, and where competitors overtake you. It is a complement to your SEO reporting, not a replacement. Below we walk through the step-by-step plan, from prompt set to interpretation, so you deliver a report you can confidently put in front of your management or client. Anyone who wants to speed up the formatting can also put AI to work on the reporting itself, as HubSpot explains about creating reports with AI.
Your buyer no longer just googles. A growing share of consumers uses AI tools as part of their purchase research, and that share keeps climbing. If your brand does not show up in those answers, you lose potential customers without noticing. A report makes that loss visible and steerable.
How does your page score? Check your GEO readiness with our free GEO tool.
What exactly is an AI visibility report?
An AI visibility report answers two questions: do we appear where our buyers actually search, and if not, what do we fix first? It does not measure whether you rank in Google, but whether language models find your content credible enough to reference in their answers.
Important to have clear from the start: this is an extra signal in your stack, not a standalone compass. AI visibility tells you whether AI systems trust your content. It does not replace your organic analytics or your conversion data. Teams that treat it as a complement to their broader organic strategy get more out of it than teams that use it as the single source of truth. That fits how we at Customer Impact look at GEO: steer on visibility that produces leads and revenue, not on a number that floats free of your business.
Want to know first which units of measurement exist before you start reporting? Then read the 5 core indicators of AI visibility. This article is about the next step: how you bring those indicators together in a report. And if you still have to choose what to measure with, the overview of AI visibility tools takes you further. If you would rather not do this yourself, our AI search optimization can set up and maintain the report for you.
Before you dive into the individual steps, this is the route you will travel: from a raw prompt set to a report you can act on.
Why your prompt set is the foundation of everything
Every number in your report flows from your prompt set. These are the specific questions your tool monitors in ChatGPT, Perplexity, Gemini and other AI systems, to see whether your content is cited in the answer. If you do not understand that set, you read your data wrong.
Most tools slap broad topic labels on clusters of prompts by default. A marketing agency, for example, sees labels like “content marketing” and “digital marketing”. Both are correct, but they cover an enormous range of subtopics. Because of that lack of specificity, you quickly draw the wrong conclusions.
Want a rough baseline fast? Semrush’s AI visibility checker gives a first picture before you invest in a full prompt set. What works better afterwards: export the full prompt list, drop it into an AI tool and ask it to summarize the underlying themes, intent types and audiences. The same list of a hundred prompts then often falls apart into much sharper themes, for example “organic and search visibility”, “paid media and SEM” and “email and conversion”. A quarter of an hour of theme analysis up front is worth it.
That exercise determines how you read everything else. If your prompt set skews heavily toward one audience, then the citation numbers for content aimed at a different audience look artificially low. That is not lost ground: you are simply being measured against prompts that page was never written for. The practical rule: only report on content that genuinely matches the prompt themes you track.
How to organize your content to report over time
Before you start reporting, you want to group your tracked pages by content type, so you can report on categories instead of repeatedly rounding up individual pages. Most tools call those groups portfolios or folders.
Keep it simple and set them up early. At the base, you want separate groups for blog articles, core pages of your website and in-depth guides. If your brand has different product lines or service areas, split those out too. The part that really counts is the working method: as soon as new content goes live, add the URL to the right group immediately. Make it part of your publishing process (publish, review, add), otherwise you will lose time during every reporting cycle tracking down pages that should have been in there long ago.
Good to know: you are not limited to your own content. You can add competitor URLs and track their citation performance in the same view, handy when you want to show where a competitor overtakes you on a specific topic.
Which numbers really belong in the report?
At the page level, you mainly look at the number of citations: how often a page has been cited across all your tracked prompts in the chosen period. If you look at citation share, that number often seems small. Makes sense: it measures the contribution of one page across your entire prompt universe, not just the prompts relevant to what the page covers. A tightly focused blog article simply has a limited citation surface relative to the full set.
You don’t need a paid tool to start. Bing Webmaster Tools has a free AI Performance report that counts how often Copilot and Bing’s AI answers cite your pages. This is ours:
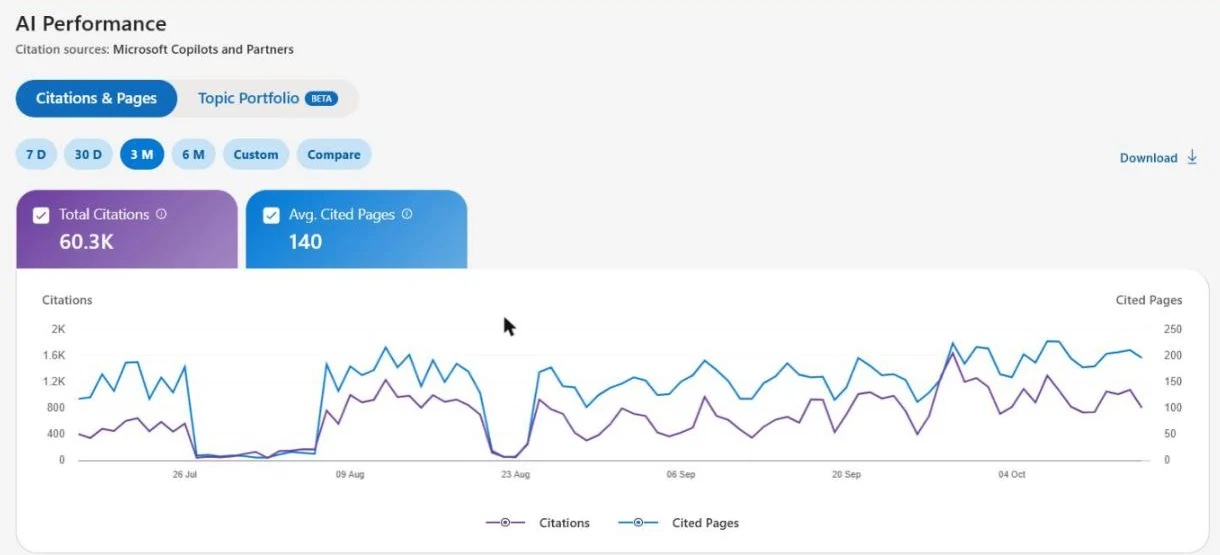 Our own Bing AI Performance report: 60.3K citations and on average 140 cited pages over three months. A free first baseline for the page-level numbers.
It only covers Microsoft’s answers, not ChatGPT or Gemini, so treat it as one input next to your tracked prompt set.
At the category level, two numbers become interesting. Citation share tells you what percentage of all AI answers cite at least one page from that group, think of it as reach for that content category. Visibility contribution goes a layer deeper: it measures what part of your total AI visibility comes from pages in that group that are cited together with a brand mention. That second number is what you really want to optimize, because it means your content and your brand name appear together in AI answers.
That combination gives direction. High citation share but low visibility contribution means AI tools do reference your pages, but do not connect them to your brand: then look at your entity consistency for AI visibility and how clearly your brand sits in the content. If a group scores low on both, that is a prioritization conversation. If a group scores strongly on both, you have proof you can scale it up. That way you avoid vanity reporting and answer the questions your management genuinely cares about.
Signal or noise: how do you read the fluctuations?
Citation data from language models is noisy by nature, and that is not a shortcoming of one tool but the way these models work. Research from SISTRIX shows that citation sources can shift significantly week over week, even when the underlying content has not been touched. Models retrain, re-rank sources and adjust sampling, and your content drifts in and out of the answers as a result.
A single data point therefore says almost nothing. The question is always whether you are looking at a trend or a snapshot. A drop in a single period is no reason to act. A consistently declining pattern across two to three months is. And before you change even one word of your content: first pull your SEO performance and your AI Overview data over the same window. If your organic traffic is stable and your AI Overview mentions stay flat, then the dip in your report is most likely a model or sampling artifact and editing content solves nothing.
Say this explicitly to your management or client. AI visibility reporting is newer and messier than classic SEO reporting. Setting that expectation up front builds credibility. Having to explain unexpected volatility after the fact does the opposite.
What an AI visibility report cannot tell you
Being honest about the limits makes your report more credible, not weaker. Three things to name:
- Prompt volume is not search volume. AI platforms do not publish search data the way Google does. Estimating how often people type a specific prompt requires multiple data sources and an estimation method. So take that volume with a grain of salt, regardless of which tool you use.
- A citation change is not buyer behavior. A drop can be a model update or a competitor with a stronger page. It does not automatically mean fewer buyers encounter your brand. That distinction requires extra signals like conversion tracking and qualitative research.
- Competition outside your set you do not see. You see how competitors perform within your prompt set, not in the AI questions you do not track at all.
The solution is the same every time: lay extra signals alongside it. Combine organic performance, your GEO and AEO analysis and broader competitive study. An AI visibility report works best as one input among several, not as the single source of truth.
From report to quick wins
A report that only measures and sets nothing in motion is wasted effort. The fastest win sits in existing pages where competitors are cited more often than you for the same prompts. Those pages usually simply lack structural elements that AI models like to pick up: an FAQ section, a comparison table, an explicit key-points block. Those signals tell the language model that a page answers a concrete question directly.
Do apply editorial judgment here, though. Not every recommendation fits every page. A conversion-focused product page does not need a sprawling FAQ that muddies the user journey, even if the data suggests it would raise your citation share. This is exactly where we value honest advice: sometimes a change does not pay off, and then we say so too.
Beyond refreshing existing pages, a good report also points to topics where competitors earn citations and you have nothing up. If a competitor is systematically cited on a theme that matches your prompt themes and your site has nothing about it, that is a real gap in your coverage, and direct input for your content calendar. Run through that list at least every quarter, alongside your regular keyword research.
Ready to map your AI visibility?
An AI visibility report does not have to be a data problem, it is usually an interpretation problem: the numbers look strange, the volatility is hard to explain and you do not know what to act on. With a sharp prompt set, content organized early, trend reading instead of snapshots and an honest list of quick wins, you put down a report your management trusts. We are a small team that moves fast and specializes in AI visibility for B2B. We build the report, read it together with you and connect it to concrete actions that produce leads. Contact us.
Frequently asked questions about an AI visibility report
Which KPIs belong in a report for management?
Start with the trend direction of your citation share over a rolling ninety-day period, not with raw citation counts. Raw numbers demand too much context. Show category-level performance for priority topics, plus concrete wins and gaps. That lands better than a single number that needs two paragraphs of explanation.
How often should I create an AI visibility report?
For most B2B brands, a monthly report is enough, read against a trend line of two to three months. Because of the natural noise in citation data, reporting weekly is usually counterproductive: you see peaks and troughs that mean nothing.
Does AI visibility replace my SEO reporting?
No. Treat AI visibility as one signal next to your organic search performance and conversion data. It tells you whether AI systems trust your content, not whether you bring in traffic or leads. The two together only give the full picture.
What do I do with a sudden drop in citations?
Nothing to the content, at first. First check whether it is a trend or a one-off dip, and lay your SEO and AI Overview data over the same window alongside it. If those stay stable, then the drop is almost certainly a model or sampling artifact and editing content solves nothing.
Free website scan
Enter your website and get an automatic scan within minutes, with concrete technical and SEO improvements. No sales pitch.
We only use your details for your scan. No spam, unsubscribe anytime.