
B2B
The economics of alignment: why aligned organizations grow 19% faster

Copy for AI
Most leadership teams spend their energy on the wrong things. They fixate on the market: is the sector growing, what is the economy doing, how aggressive are the competitors. All important, and all largely outside your control.
Meanwhile, the biggest growth lever that you do hold entirely in your own hands sits there untouched. That lever is alignment: the alignment between marketing, sales and product.
I deliberately use the word “economics” in the title, because that is exactly what this is about. Not team building, not “understanding each other better”, but hard numbers on revenue and profit.
The numbers come from SiriusDecisions, now part of Forrester. Co-founder John Neeson presented the study at Summit 2015: benchmark data from 400 B2B organizations (2006 to 2014), plus answers from 300 B2B sales, marketing and product leaders. Forrester still quoted the headline figures in its 2018 report on marketing alignment. The conclusion is unambiguous:
Aligned organizations achieve up to 19% faster revenue growth and 15% higher profitability than other companies.
In this article I dissect the full story: the proof that alignment drives growth, how to make alignment measurable, the four phases in which it develops, why it stays so hard (especially at scale), and the concrete roadmap to grow from phase to phase. It is long and it is data-heavy, because this is a conversation for the boardroom table, not for a blog summary. At the bottom you will find the full presentation as a download.
What is alignment, really? (and what it is not)
Let’s start by clearing up a misunderstanding. For most people, alignment means “sales and marketing getting along well”. A shared drink, a few agreements about lead handoff, and done.
That is not what I mean. Alignment is the structural alignment of strategy, processes, goals and measurement across three functions. And note that number: three, not two.
Almost every article on this topic is about “smarketing”, the coupling of sales and marketing. But in the companies that genuinely grow above average, there is a third party at the table: product. Marketing promises, sales sells, and product has to deliver on it. Whoever fails to close that triangle keeps endlessly fighting symptoms between two departments while the real cause lies with a third.
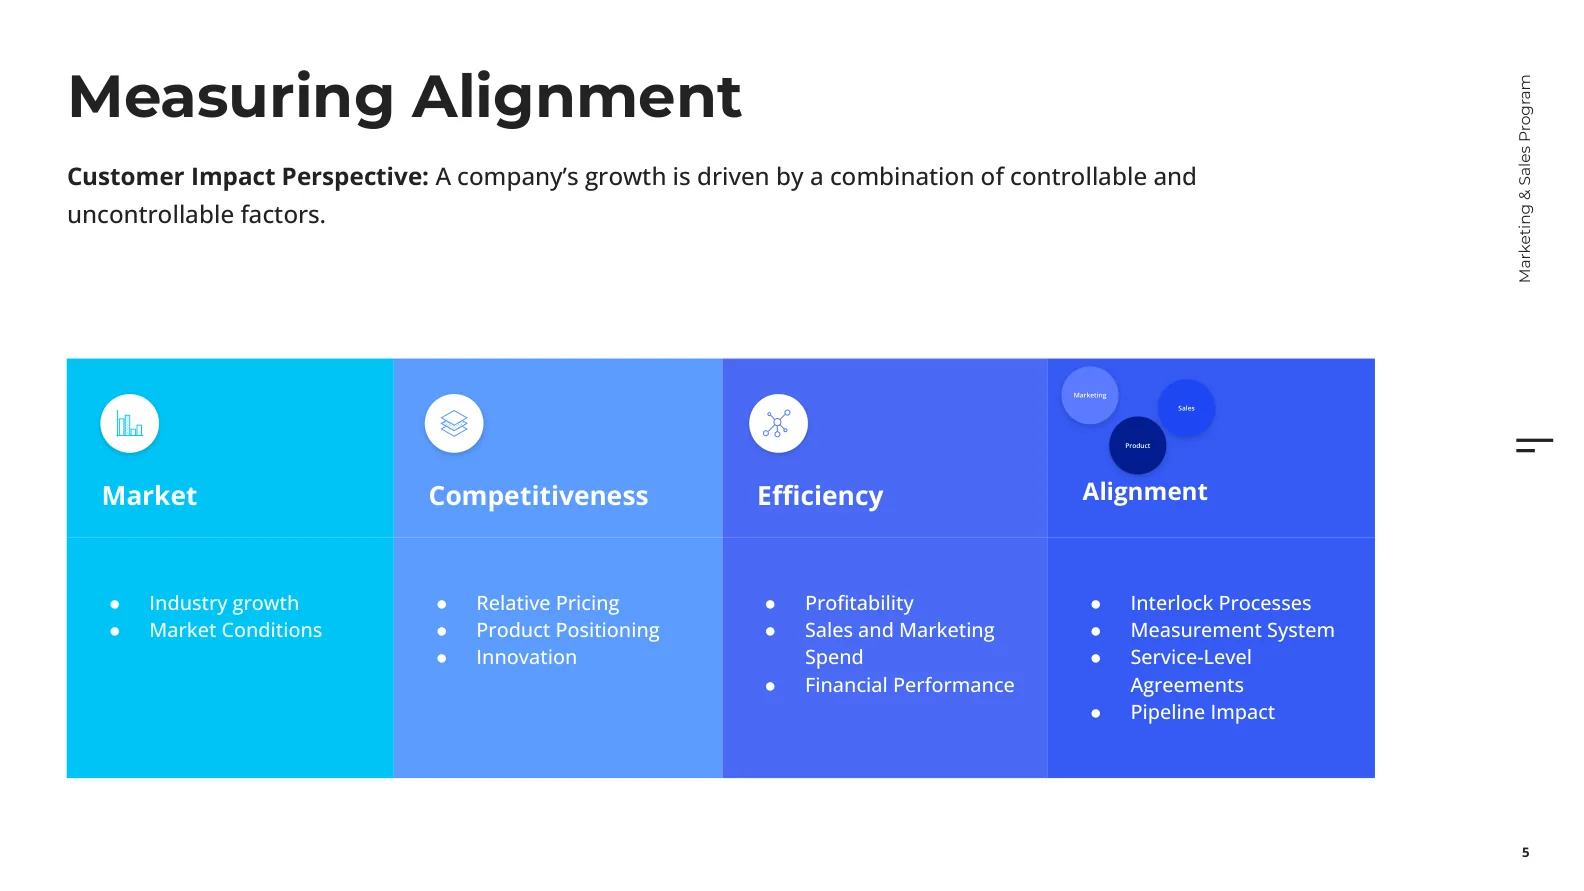
The study’s starting point is that a company’s growth is driven by a combination of controllable and uncontrollable factors. Four categories:
- Market: sector growth and market conditions. Uncontrollable.
- Competitive strength: relative price, product positioning, innovation. Partly controllable.
- Efficiency: profitability, sales and marketing spend, financial performance. Controllable.
- Alignment: interlocking processes, measurement system, SLAs, pipeline impact. Fully controllable.
Most leadership teams put their best people on the first category, where they can change the least. The real return sits in the last one, where they hold everything in their hands.
Why it is a triangle, not a couple
The forgotten leg of the triangle is almost always product. Marketing generates demand around a promise, sales sells that promise, and if product heads in a different direction a gap appears that translates into churn, long sales cycles and dissatisfied customers. A healthy alignment model treats product as an equal partner in the alignment of the B2B buyer journey, not as a separate silo that guards “the roadmap”.
The proof: alignment is the growth engine you overlook
Time for numbers. The study asked one question: why do some companies grow faster than their peers? By decomposing B2B growth into its sources, you can isolate the contribution of each factor.
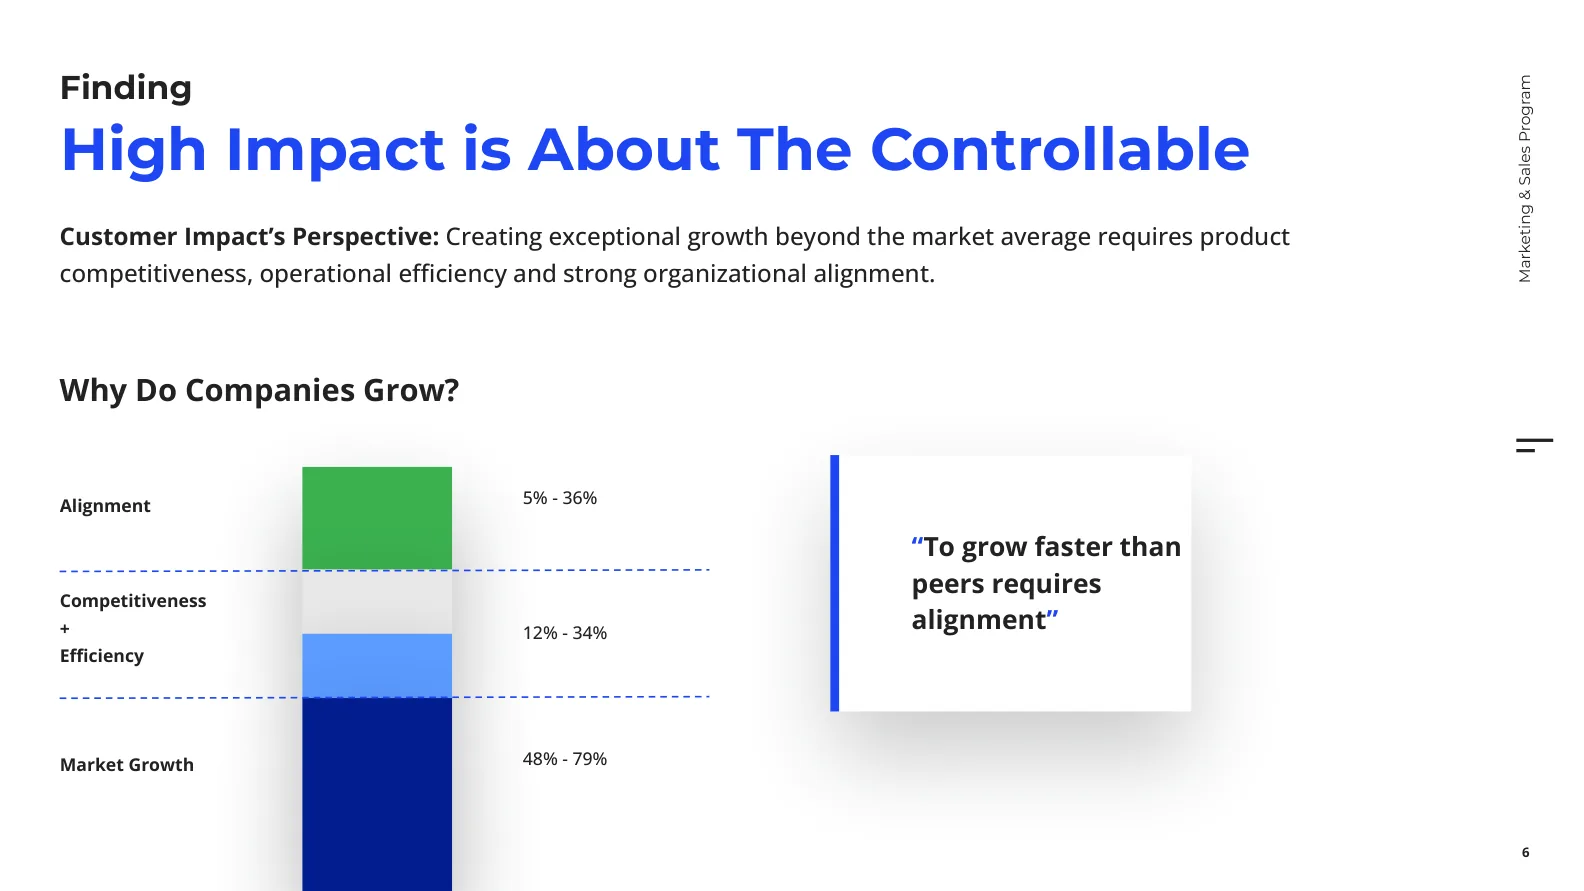
The decomposition looks like this:
| Growth factor | Share of B2B growth it drives |
|---|---|
| Market growth | 48% to 79% |
| Competitive strength + efficiency | 12% to 34% |
| Alignment | 5% to 36% |
Read that last row again. Alignment drives between 5% and up to 36% of B2B growth. That is not a margin, that is a strategic difference. And unlike market growth, it’s fully within your control.
The conclusion of the whole study I’m happy to sum up in one sentence: to grow faster than your competitors you need alignment. Not as the only factor, but as the factor you can steer yourself.
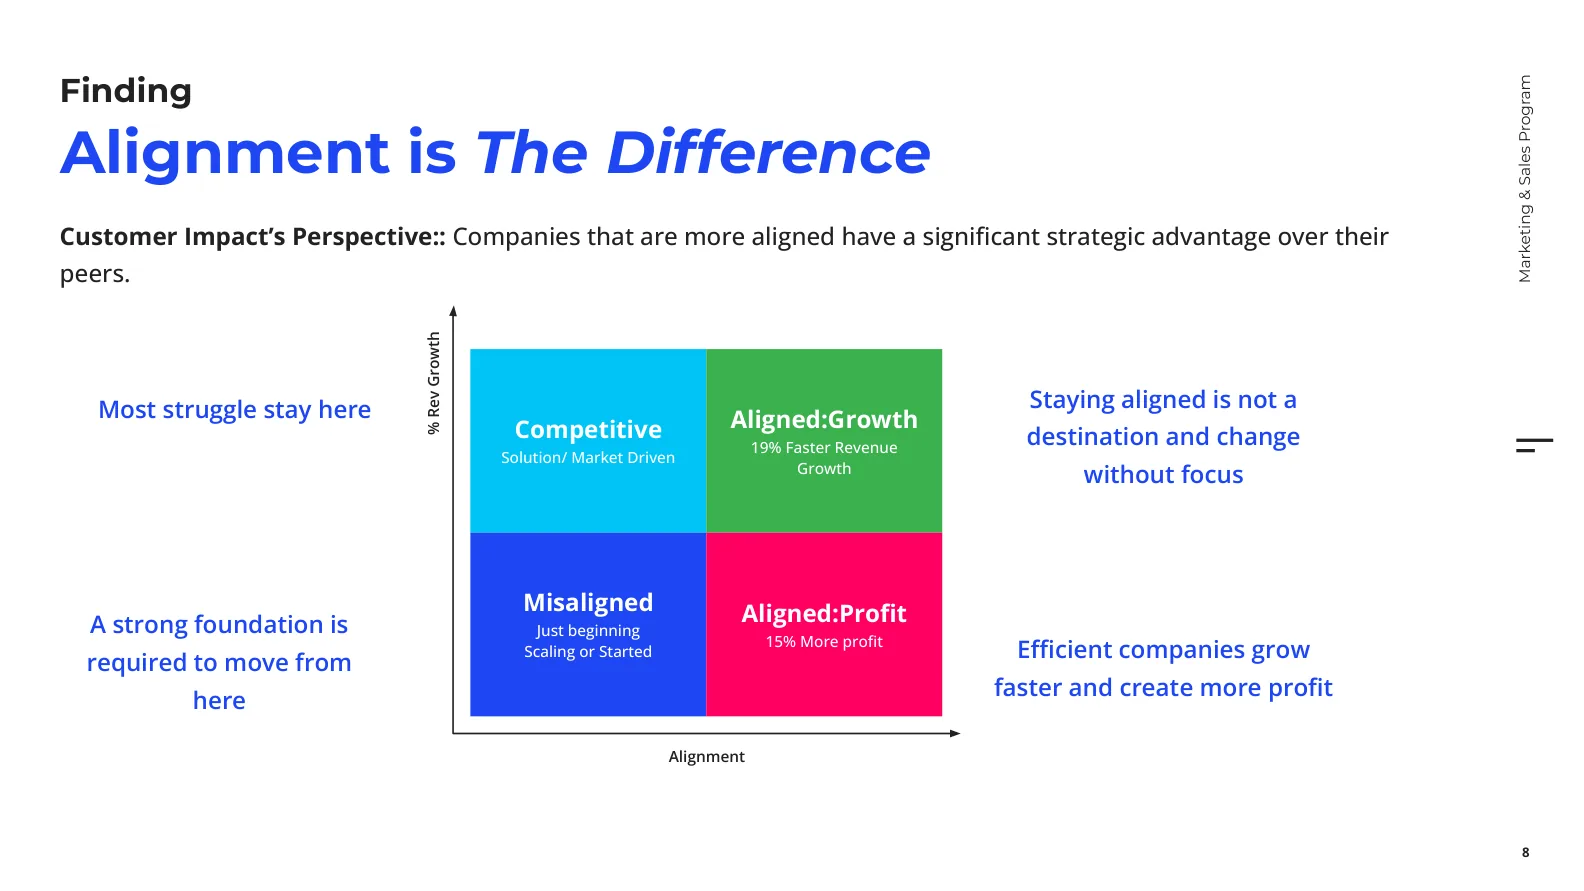
Translated into the two numbers that count in every boardroom:
- Up to 19% faster revenue growth
- 15% higher profitability
What that compounds over time
Numbers per year underestimate the impact, because growth is cumulative. Say a B2B company grows 10% per year without alignment. An aligned competitor that grows 19% faster then grows about 11.9%. Sounds modest.
But over five years the first company grows 61% and the aligned one about 75%, so the aligned company ends up roughly 9% bigger. And that’s before you factor in the 15% higher margin. The difference between “we’re doing okay” and “we’re pulling ahead of the market” sits precisely in that seemingly small lead, repeated year after year.
The cost of misalignment
The flip side is at least as important. Misalignment is not neutral, it actively costs money. Marketing generates leads that sales never follows up. Sales complains about lead quality without anyone having pinned down the definition of a good lead. Product builds features that nobody in the field asked for. Each of those frictions lengthens the sales cycle, raises the cost of acquisition and lowers the win rate. The money leaks away in places that no dashboard looks at, because responsibility falls between three departments.
Measure your Alignment Quotient: the five elements
“Collaborate better” is not a goal you can steer on. That is why the SiriusDecisions study makes alignment measurable through an Alignment Quotient: five elements that you can each score from low to high.
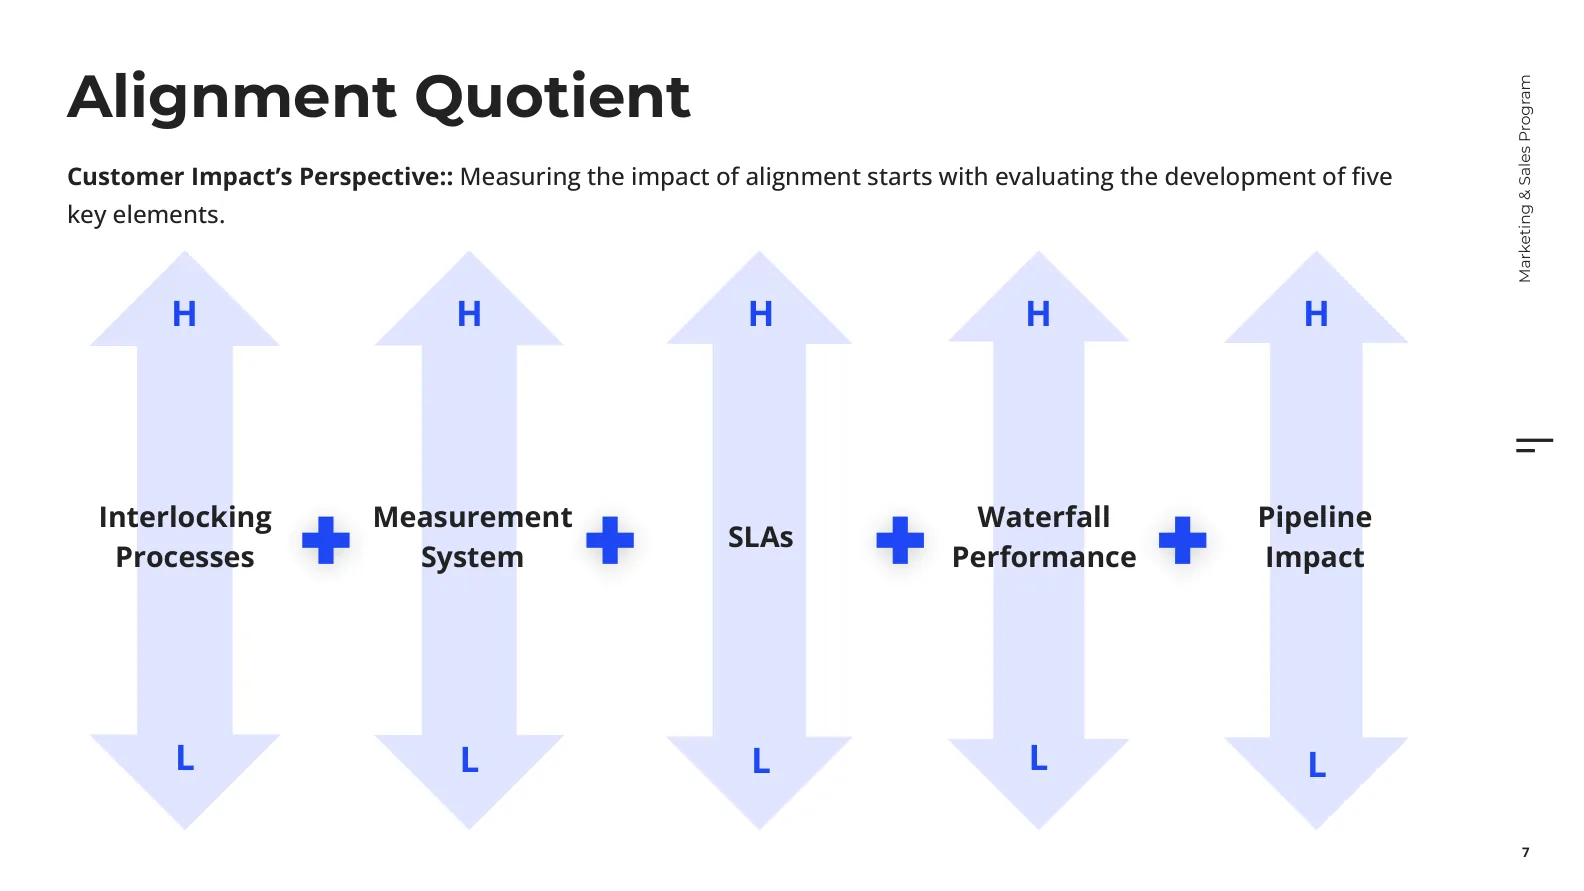
The five elements are:
1. Interlocking processes
The degree to which the processes of marketing, sales and product engage with each other instead of running side by side. Scoring high means the handoff between functions is explicitly designed, not improvised.
Diagnostic question: can everyone across the three teams describe what happens the moment a lead moves from marketing to sales, and what product does with it?
2. Measurement system
One shared definition of success, with numbers every team recognizes and trusts. You recognize a low score by three departments that each defend their own dashboard with different numbers about the same reality.
Diagnostic question: do marketing, sales and product report on the same North Star, or does each have its own version of the truth?
3. SLAs
Service-level agreements between the functions: firm agreements about what one function delivers to the other, in what quality and within what timeframe. Not intentions, but enforceable commitments.
Diagnostic question: is there an agreement about how many qualified leads marketing delivers and about how fast sales follows up on them?
4. Waterfall performance
The health of your funnel or waterfall: the conversion from phase to phase, from first contact to closed deal. An aligned organization knows its conversion rates at every level and steers on them.
Diagnostic question: do you know where in the waterfall you lose the most, and is that a shared problem or the fault of “the other team”?
5. Pipeline impact
The degree to which marketing demonstrably contributes to the pipeline, and sales and product acknowledge that contribution. This is the element that measures the endgame: not activity, but revenue impact.
Diagnostic question: can you demonstrate what share of closed revenue was sourced or influenced by marketing?
Score yourself honestly on these five. The pattern you see tells you not only how aligned you are, but also precisely where you should start.
The four phases of alignment: where do you stand?
Alignment is not a switch you flip. It is a journey that develops across four recognizable phases, and each phase has its own characteristics and its own next milestone.
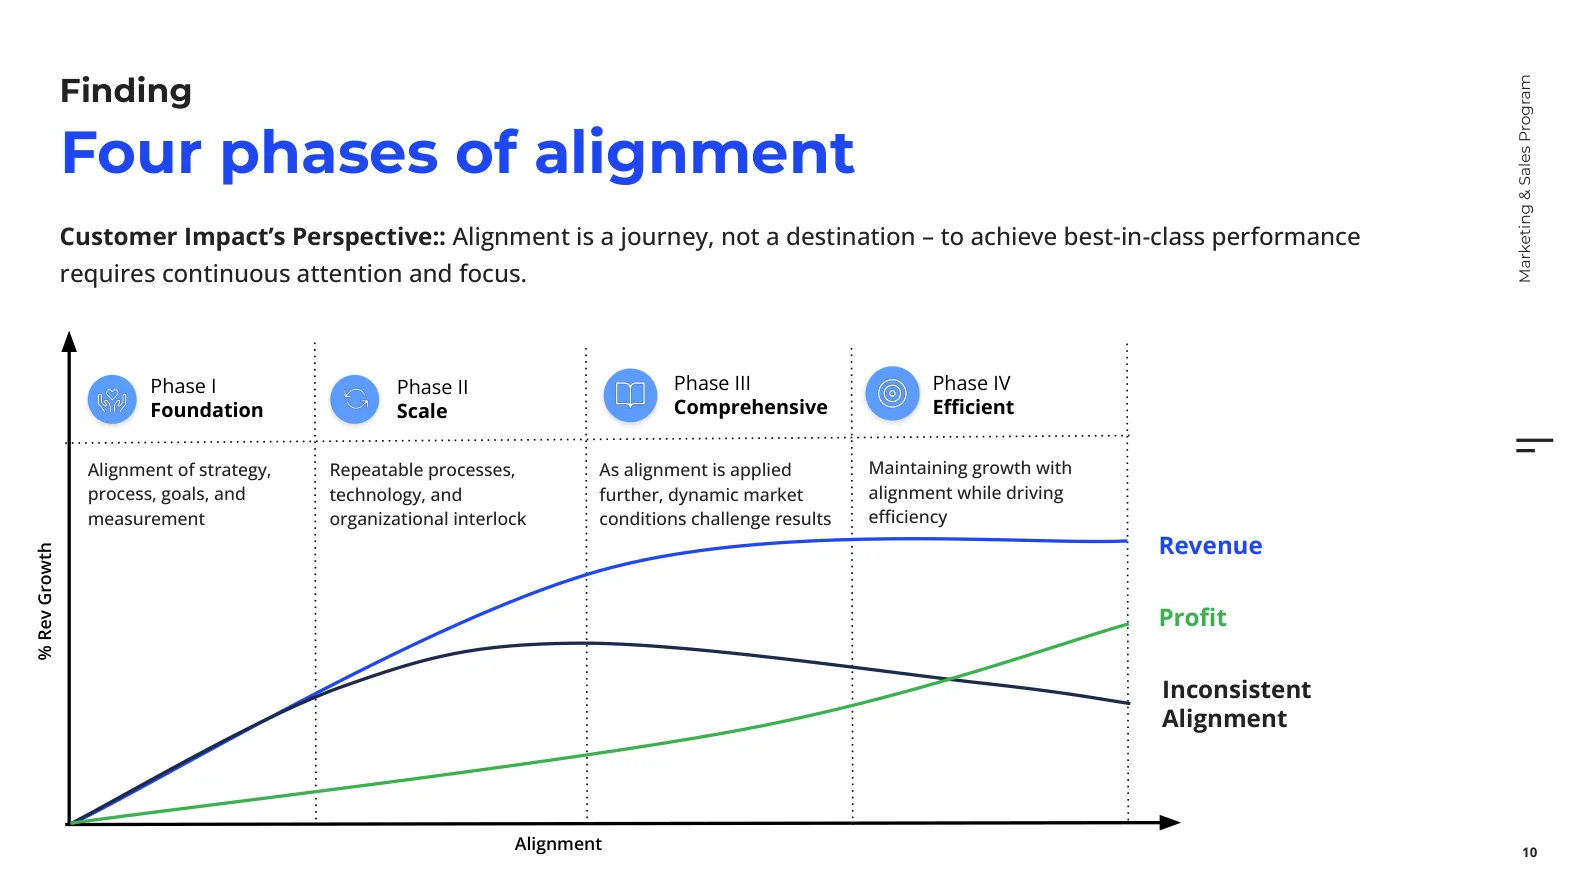
Phase I: Foundation
Aligning strategy, process, goals and measurement. This is the base. You establish who does what, on which numbers you steer together and how the handoff between teams works.
Here is how to recognize you are here: there is goodwill, but agreements live in people’s heads and not in systems. The next milestone is to make those agreements repeatable and explicit.
Phase II: Scale
Repeatable processes, supported by technology and organizational interlock. The agreements from phase 1 now become systems: a dashboard, defined lead scoring, SLAs that are actually adhered to.
Here is how to recognize you are here: the basic processes run, but they break as soon as volume or complexity increases. The next milestone is to make alignment resistant to change.
Phase III: Comprehensive
Alignment is applied across the full breadth, while dynamic market conditions challenge the results. Here you refine: segmentation, coverage models, win-loss analysis, forecast management.
Here is how to recognize you are here: alignment holds up under pressure, but still demands a lot of manual steering. The next milestone is efficiency.
Phase IV: Efficient
Sustaining growth while staying aligned, while steering on efficiency at the same time. This is best-in-class: alignment is no longer a project but a built-in rhythm, supported by predictive measurement and one platform.
Here is how to recognize you are here: the organization stays aligned without it demanding constant leadership attention, and you optimize on margin without giving up growth.
Why alignment is so hard (and gets worse at scale)
If alignment is such a clear growth lever, why isn’t everyone in phase 4? Because it is hard. And, counterintuitively, it gets harder as you grow bigger.
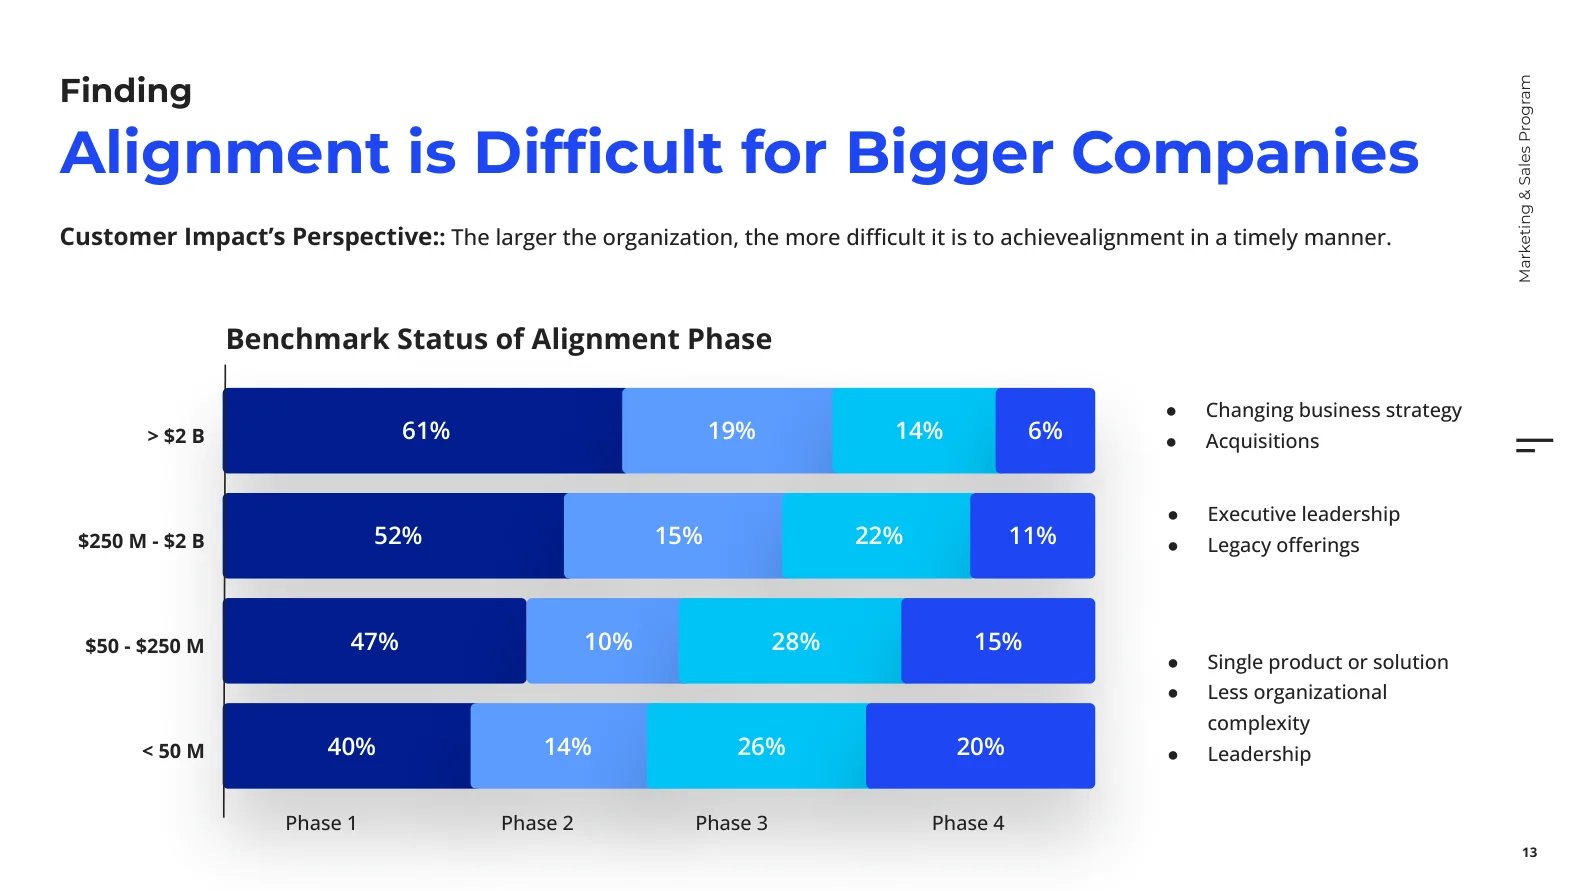
Here is the distribution of companies across the four phases, split by size, as shown in the SiriusDecisions presentation:
| Size (revenue) | Phase 1 | Phase 2 | Phase 3 | Phase 4 |
|---|---|---|---|---|
| More than 2 bn $ | 61% | 19% | 14% | 6% |
| 250 M to 2 bn $ | 52% | 15% | 22% | 11% |
| 50 to 250 M $ | 47% | 10% | 28% | 15% |
| Less than 50 M $ | 40% | 14% | 26% | 20% |
Read the top row: 61% of the largest companies are still in phase 1, and barely 6% reach phase 4. At the bottom of the table, among the smallest companies, phase 4 is more than three times higher. The agility of a smaller organization is an underestimated strategic advantage.
Why does it get harder at scale? The biggest culprits:
- A shifting business strategy that undermines alignment every single time
- Acquisitions that bring in new teams, systems and cultures
- Legacy offerings that don’t fit the new model
- Organizational complexity that slows down every agreement
- Leadership that is not on the same line about direction
What leaders themselves see as the biggest obstacle
The study put the question to 300 B2B leaders directly. Their answer is surprisingly unanimous, and it points not outward but inward.
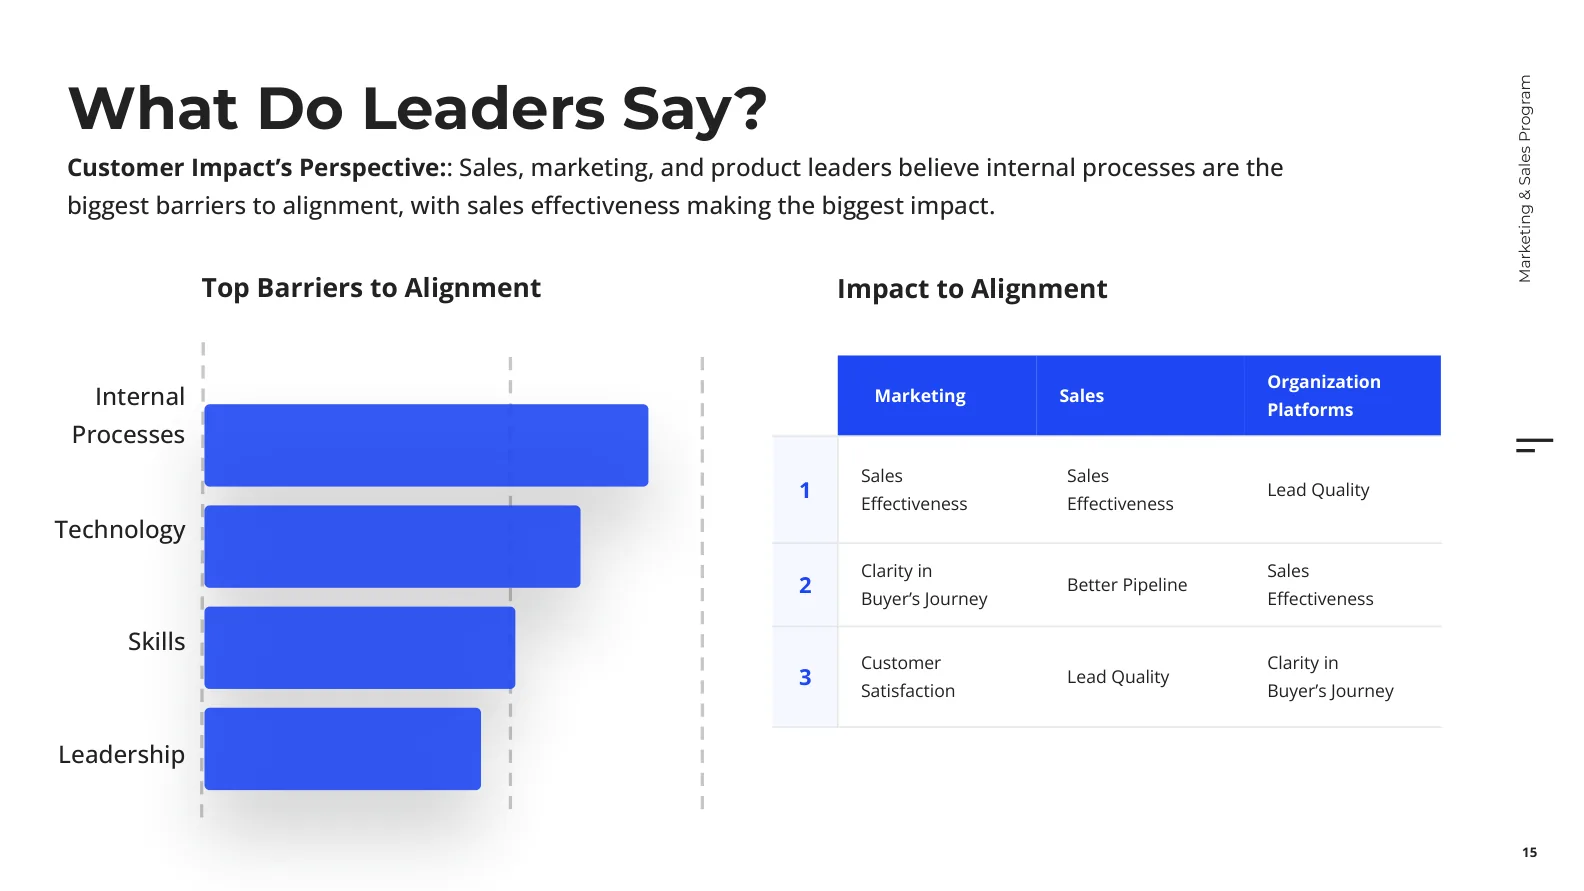
The biggest barriers to alignment, ranked:
- Internal processes (by far the biggest)
- Technology
- Skills
- Leadership
It is not a technology problem and not a talent problem. It is a process problem. The way work flows between the functions is the bottleneck.
And when we look at what has the biggest impact on alignment, one factor stands out:
- Sales effectiveness (the biggest lever)
- Lead quality
- Clarity in the buyer journey
In other words: if you want to move the needle the hardest, focus on the effectiveness of sales, the quality of the leads they get, and the clarity of the buyer journey that marketing and product shape together.
The playbook: six levers that move you from phase to phase
Now the concrete part. How do you get from where you stand to the next phase? The SiriusDecisions framework names six levers that let organizations grow through while raising revenue or profit.
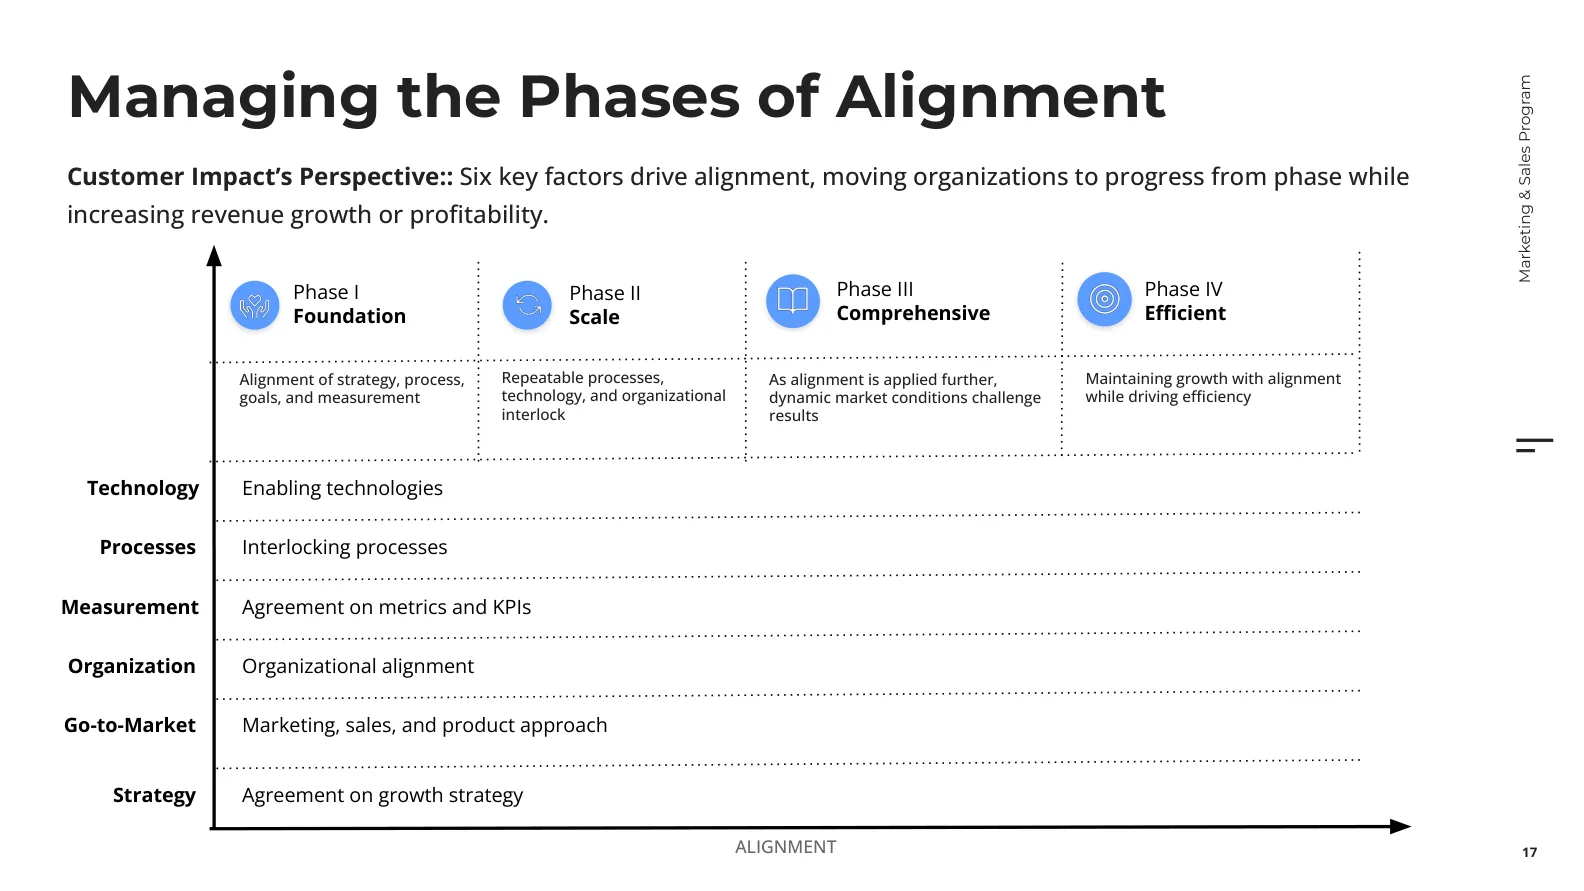
The six levers:
- Strategy: agreement on the growth strategy
- Go-to-market: a shared marketing, sales and product approach
- Organization: organizational alignment and ownership
- Measurement: agreement on metrics and KPIs
- Processes: interlocking processes between the functions
- Technology: supporting technology that makes alignment possible
What is powerful sits not in the six levers themselves, but in how they evolve per phase. Each lever has a different character depending on where you stand on the curve. This is the roadmap, condensed into one table:
| Lever | Phase I: Foundation | Phase II: Scale | Phase III: Comprehensive | Phase IV: Efficient |
|---|---|---|---|---|
| Technology | Base | Dashboard | Architecture | Knowledge |
| Processes | Interlock | System | Hierarchy | Advantage |
| Measurement | Productivity | Impact | Insights | Predictive |
| Organization | Leadership | Ecosystem | Coverage | Leverage |
| Go-to-market | Buyer | Experience | Spectrum | Dynamic |
| Strategy | Pillar | Pillars | Priority | Adaptable |
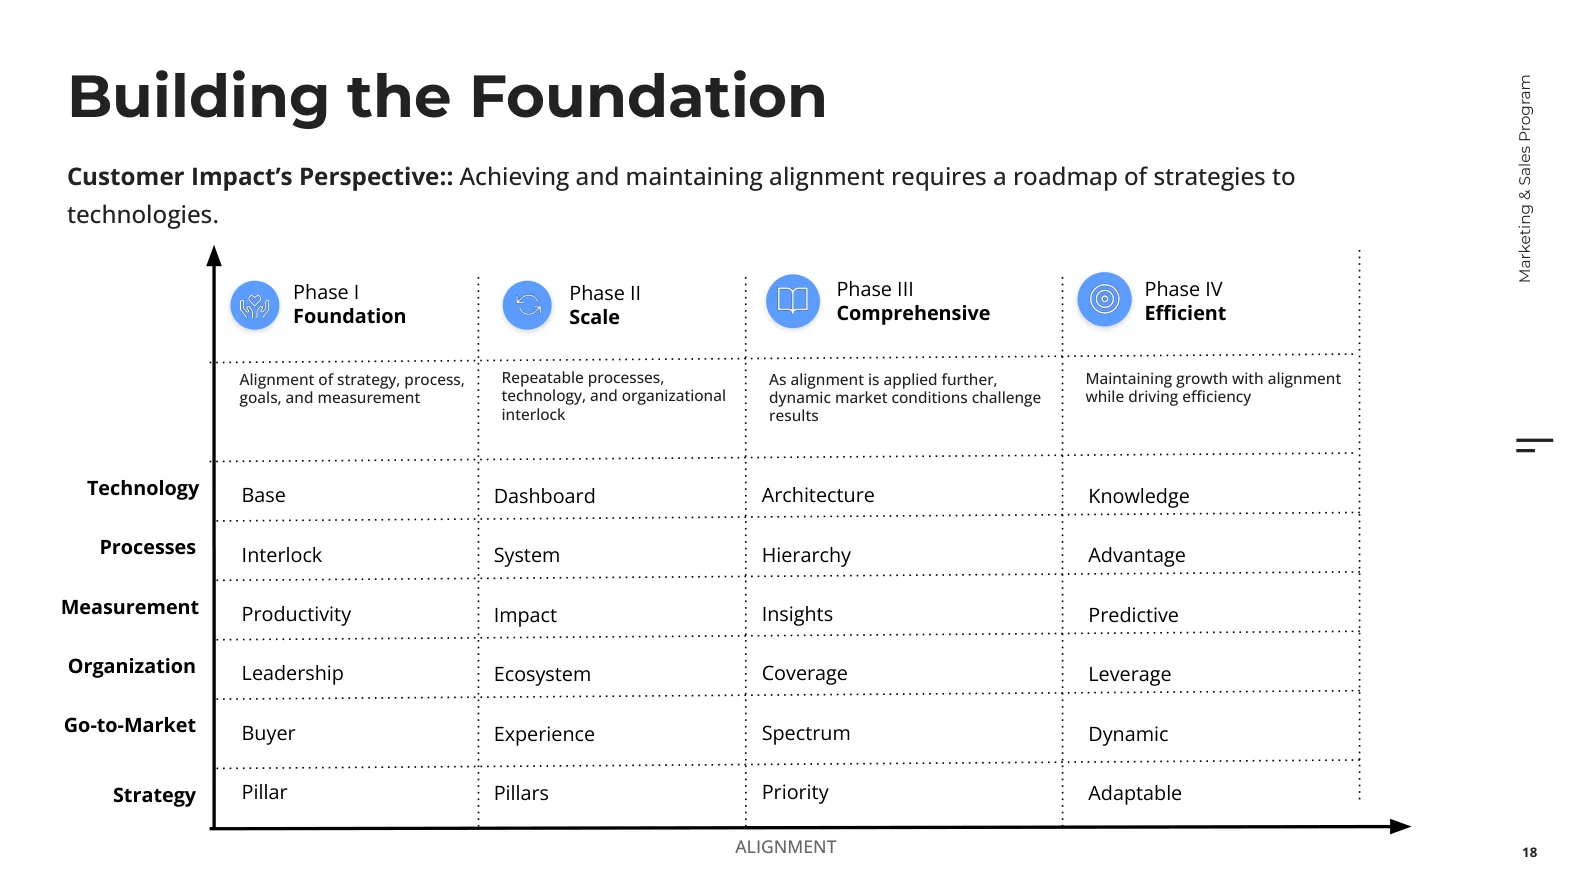
Read the table as a ladder. Take the row Measurement: you start at productivity (are we doing the things?), grow to impact (does it work?), then to insights (why does it work?) and finally to predictive (what is going to work?). That same logic applies to every row.
A few concrete fills that emerge from the research per phase:
- Phase II (Scale): setting up waterfall metrics and web analytics, pinning down the lead definition and SLAs, installing lead scoring and lead nurturing, building a campaign framework, rolling out marketing automation and sales automation.
- Phase III (Comprehensive): a competency model and channel enablement for sales, forecast management, onboarding processes, a sales productivity model, and re-evaluating segmentation and coverage.
- Phase IV (Efficient): win-loss analysis and product performance, value-based pricing, a persona and innovation model, one platform with visual KPIs, and predictive measurement that feeds the whole organization.
Notice how the levers come together around the three functions. In the later phases each function gets its own fill: marketing around demand and content, sales around coverage and enablement, and product around launch models and lifecycle. It is no coincidence that this is precisely the place where the structure of your marketing team and your pipeline approach have to meet.
Alignment is continuous: the maintenance problem nobody schedules
Here is the mistake I see organizations make time and again. They treat alignment as a project: an initiative with a beginning and an end, a steering committee, a closing party. And then, a year later, everything has drifted apart again and nobody understands why.
The reason is simple: alignment is not a destination, it is a rhythm. And it is constantly challenged by change.
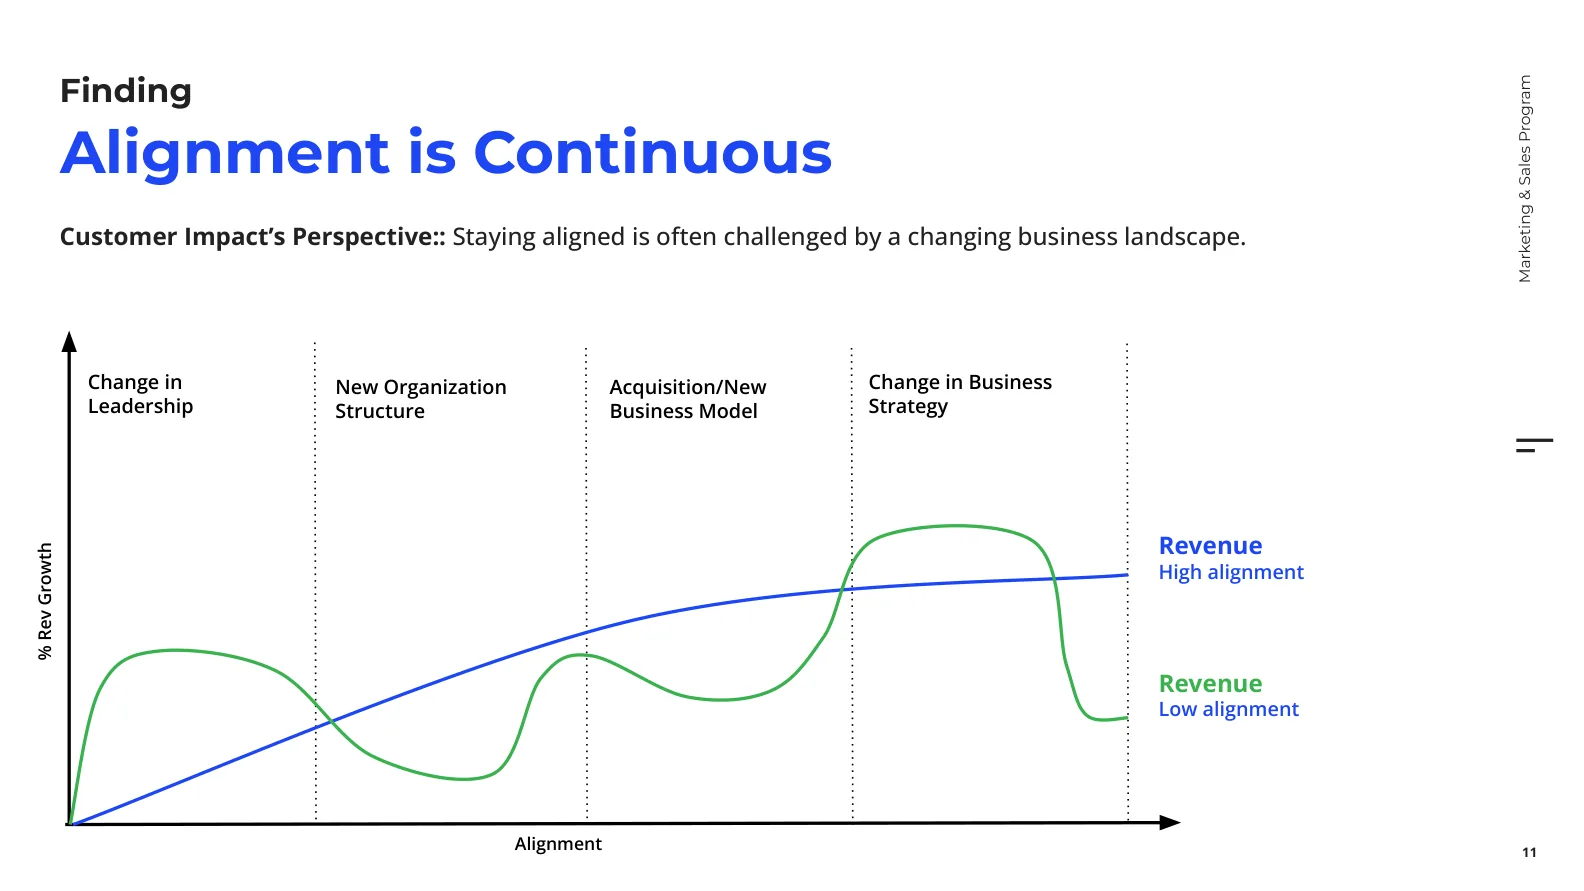
Four kinds of change throw alignment off every single time:
- A change in leadership. A new CMO, CRO or CEO brings new priorities and reopens existing agreements.
- A new organizational structure. A reorganization shifts responsibilities and breaks the interlock that had just been built.
- An acquisition or new business model. Two cultures, two tech stacks and two ways of working that suddenly have to merge.
- A change in business strategy. A new market, a new segment or a new offering that puts the whole alignment to the test again.
The difference between an organization with high and low alignment is not that the first is never disrupted. It is that the first has a rhythm to recover quickly after every disruption, while the second experiences every shock as a crisis and watches revenue sink.
The C-level conclusion: put alignment on the agenda as a standing operational rhythm, not as a one-off initiative. A fixed moment, fixed owners, fixed numbers. Otherwise you pay the price again and again.
The action plan per role in the C-suite
Enough analysis. This is what each member of the leadership team can concretely do. I have deliberately split it per role, because alignment only succeeds if responsibility is distributed and ownership is explicit.
The CMO (marketing):
- Draw up a roadmap for alignment and make it visible to the whole organization.
- Concentrate on the core process of each alignment phase instead of wanting to do everything at once.
- Set the stage for the journey: make clear to the organization where you stand and where you are headed.
The CRO (sales):
- Quantify the productivity gain that alignment delivers, in numbers the boardroom understands.
- Focus on the SLAs and the technology that genuinely make alignment possible.
- Take the lead in the conversation about the growth-pillar strategy.
The CPO (product):
- Look at alignment in the context of offering coverage: does your offering cover what marketing promises and sales sells?
- Pin down the key roles, responsibilities and deliverables for all product-related roles.
The first 90 days
If you want to start tomorrow, you don’t need to do everything at once. A realistic starting schedule:
- Week 1 to 2: score your Alignment Quotient on the five elements. Honestly, with the three functions together at the table.
- Week 3 to 4: determine which phase you are in and what the very next milestone is. Choose one lever to start with.
- Month 2: pin down the basic agreements that are missing, starting with the lead definition and the SLA between marketing and sales.
- Month 3: set up one shared measurement system that all three functions report on, and schedule the recurring alignment rhythm.
You don’t have to end up in phase 4. You just have to move one phase forward, and keep that rhythm going.
Conclusion: the highest ROI your board determines entirely itself
Let me bring it back to the core. Market growth you cannot steer. Competitors you cannot control. But the alignment between your own marketing, sales and product? That you hold entirely in your hands.
And the return is exceptional: up to 19% faster revenue growth, 15% higher profitability, and up to 36% of B2B growth driven by alignment. No external factor offers that combination of impact and control.
Alignment is not a soft ambition. It is economics. And it is, for most leadership teams, the most underused growth lever they have.
Do you want the full research report, with all the data and the roadmap, to present to your own leadership team? Download the full presentation.
If, afterwards, you want to spar about where your organization stands and which lever makes the first difference, then look at our approach around marketing strategy. Not a sales pitch, but a conversation about your Alignment Quotient.
Frequently asked questions
What is marketing and sales alignment?
Alignment is the structural alignment of strategy, processes, goals and measurement between marketing, sales and product. It goes further than “collaborating well”: it means shared definitions, enforceable SLAs, one measurement system and processes that explicitly engage with each other. Contrary to what most stories suggest, it is a triangle of three functions, not just a couple of sales and marketing.
How much faster do aligned companies grow?
According to SiriusDecisions research across 400 B2B companies (benchmark data 2006 to 2014), aligned organizations achieve up to 19% faster revenue growth and 15% higher profitability than other companies. Alignment drives between 5% and 36% of B2B growth.
How do you measure alignment?
Through the Alignment Quotient: five elements that you each score from low to high. It’s about interlocking processes, a shared measurement system, SLAs between the functions, waterfall performance (the conversion through your funnel) and pipeline impact (the demonstrable contribution of marketing to revenue). The pattern of your scores tells you where you should start.
Why does product belong to it?
Because marketing promises, sales sells and product has to deliver on it. If product heads in a different direction than what is promised in the market, a gap appears that translates into churn, long sales cycles and dissatisfied customers. Alignment that leaves product out of consideration only ever solves half the problem.
Where do you start with alignment?
First score your Alignment Quotient with the three functions together at the table and determine which phase you are in (Foundation, Scale, Comprehensive or Efficient). Choose one lever to start with, most often the lead definition and the SLA between marketing and sales, and set up one shared measurement system. The goal is not to end up in phase 4, but to move one phase forward and keep that rhythm going.
Why is alignment harder for large companies?
Because scale brings complexity: shifting strategy, acquisitions, legacy offerings and heavier organizational structures undermine alignment every single time. The research shows that 61% of companies above 2 billion dollars are still in phase 1, compared with much higher progression among smaller, more agile organizations.
Free website scan
Enter your website and get an automatic scan within minutes, with concrete technical and SEO improvements. No sales pitch.
We only use your details for your scan. No spam, unsubscribe anytime.