
Leadgeneratie
The lead generation KPIs that actually matter (and the ones you can ignore)

Copy for AI
Steer on pipeline KPIs, not on the numbers that are easiest to show.
Your dashboard is probably full: leads this month, clickthrough rate, cost per click, form fills, open rate. It looks busy and healthy.
Yet sales doesn’t know whether the pipeline is growing. And nobody knows which channel produces revenue.
The verdict: a good lead generation dashboard gets emptier, not fuller. Three or four pipeline numbers beat thirty activity metrics.
Below is a KPI framework that separates vanity numbers from the few that decide whether your lead generation contributes to revenue.
Why do most lead generation KPIs mislead you?
Because they go up without your business being any better off.
That’s the definition of a vanity metric. Lead count is the classic example.
Lead count is easy to inflate
You could double it tomorrow:
- put a free giveaway behind a form
- lower your qualification criteria
The dashboard gets prettier, your sales team gets angrier, and revenue doesn’t change.
The further from the deal, the less it tells you
The problem is structural. Vanity numbers sit at the top of the funnel, where volume is high and meaning is low.
They measure activity, not results. They’re easy to collect and easy to grow, so they’re tempting to report.
Pipeline numbers work the other way around. They measure whether a lead is moving toward becoming a customer.
They’re harder to collect, because you need a working CRM and honest attribution. But they’re the only numbers you can base a growth decision on.
Say you got 200 leads this month. Channel A produced 4 deals, channel B produced 0.
Knowing that is the difference between a report and a steering wheel.
Which lead generation KPIs should you track?
One per layer, across four measurement points from lead to revenue.
At each point you ask one question:
Here are the four KPIs side by side:
| Layer | Question | KPI | How to calculate it |
|---|---|---|---|
| 1. Inflow | Enough raw leads? | Lead count (monitor only) | Leads per period |
| 2. Qualification | How many are sales-ready? | Lead-to-SQL ratio | SQLs ÷ leads |
| 3. Conversion | How many become customers? | SQL-to-deal ratio | Won deals ÷ SQLs |
| 4. Return | What does a customer cost? | Cost per customer per channel | Channel spend ÷ new customers |
Layer 1. Inflow: am I getting enough raw leads?
This is where lead count belongs. Not as a target, but as monitoring.
It shows whether your source is drying up. It says nothing about quality.
Use it as: a smoke alarm, not a scoreboard.
Layer 2. Qualification: how many leads are sales-ready?
This is your first real KPI: the lead-to-SQL ratio. It’s the percentage of leads that become a sales-qualified lead: for example, 20 SQLs from 100 leads is 20%.
HubSpot’s lifecycle stage definitions draw the line cleanly. Marketing qualifies an MQL as ready for sales, but only sales qualifies an SQL as a potential customer.
Here’s where HubSpot sets those stages out:
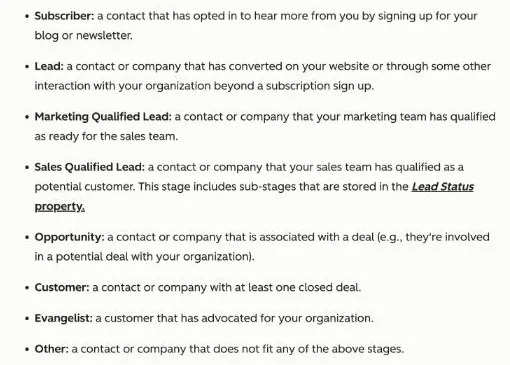 HubSpot’s lifecycle stage definitions, checked 18 October 2026. Marketing hands over the MQL, but only sales decides what counts as an SQL.
If this ratio drops, you’re attracting the wrong people, however high your volume is.
Our experience: fewer non-fitting companies in the funnel means significantly less overhead, on your website, in your process and for your sales team.
Layer 3. Conversion: how many sales-ready leads become customers?
Here you measure the SQL-to-deal ratio and the average lead time from lead to deal.
It tells you whether your sales process and your lead quality line up.
Watch out: high inflow with a low SQL-to-deal ratio often means marketing and sales use different definitions of a good lead.
Layer 4. Return: what does a customer cost and deliver?
The final bosses: cost per customer, your customer acquisition cost, and its ratio to customer value.
This is what a board steers on.
For example, a channel with expensive leads but a low cost per customer beats a channel with cheap leads that never sign.
Where the vanity numbers go
Notice that clicks, impressions and form fills appear nowhere in this framework.
They’re not worthless. They’re diagnostic signals for your marketers, not steering numbers for your growth.
Keep them in a separate, deeper dashboard, away from the results conversation.
Which KPIs can you safely ignore at board level?
The ones that measure an intermediate step instead of an outcome.
A few numbers get far too much attention, such as these 4:
- follower count
- email open rate
- website visitors in isolation
- cost per click
They belong with the specialist optimising a channel. Not in the report that decides where the budget goes.
The one-question test
The test is simple: if the number goes up, are you certainly closer to revenue?
If you can’t say yes, it’s a diagnostic number, not a KPI. It may exist, but it may not steer your decisions.
Want to dig into raw contacts versus usable leads? Read on about qualified leads and why quality beats volume.
How do you compare lead generation channels fairly?
At deal level, not at lead level.
The most expensive mistake in measuring lead generation is comparing channels on cost per lead.
Why cost per lead lies
The channel with the cheapest leads always wins that comparison, so your budget shifts that way.
But if those cheap leads rarely sign while the expensive ones keep becoming customers, you’re optimising your best channel into the ground.
Volume and value often point in opposite directions. Our own GA4 shows it for one small channel, chatgpt.com referrals:
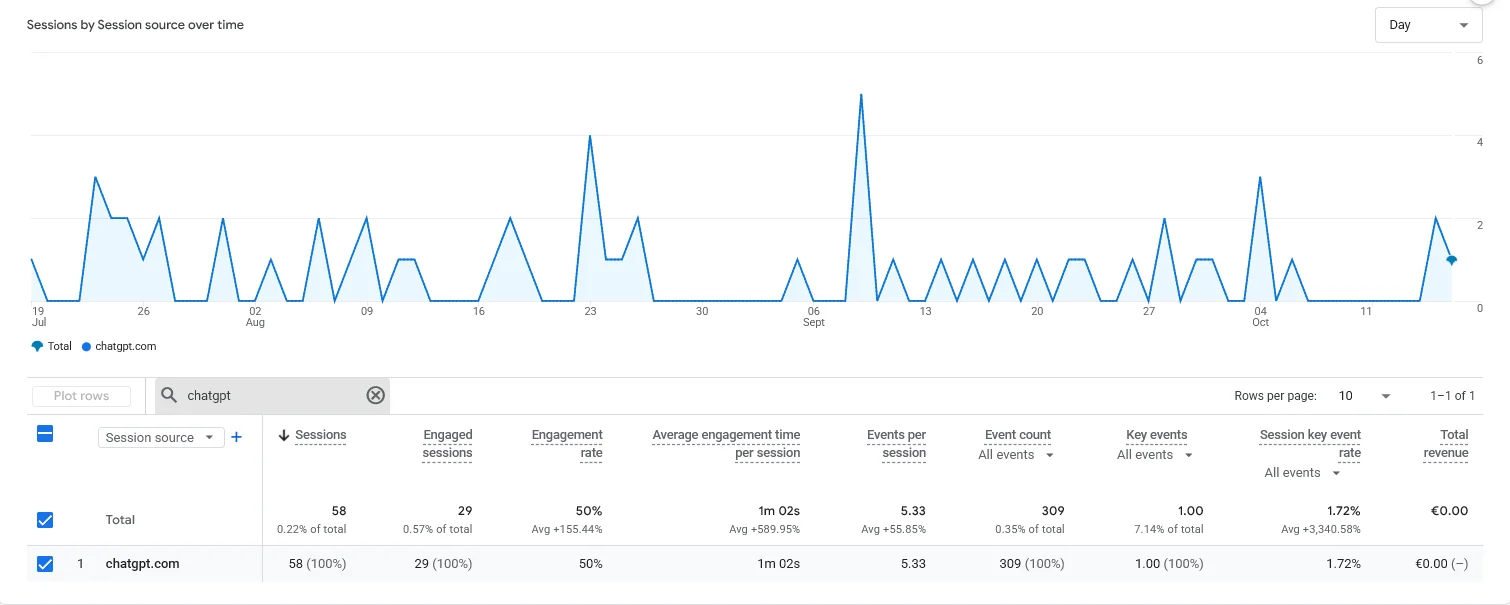 GA4 traffic acquisition for customerimpact.be, October 2026: chatgpt.com brought 0.22% of sessions in 90 days, yet 7.14% of all key events.
Judged on volume, 0.22% of sessions looks irrelevant. Judged on outcomes, 7.14% of key events punches far above its weight.
Attribution down to deal level
The fix is attribution all the way to the deal. Tie every won deal back to the channel, the campaign and the first lead that started it.
That demands CRM discipline, for example a required source field on every deal.
Without a clean link between lead and deal, every return number stays guesswork.
Our experience: the recurring CRM problems are data out of sync, deals not updated or attributed to the right team, and people who don’t want to do admin.
Your ad platforms won’t do it for you
Google Ads no longer supports first click, linear, time decay or position-based attribution. Only data-driven and last click remain.
You can see it in any conversion action’s settings. Here’s one from our own account:
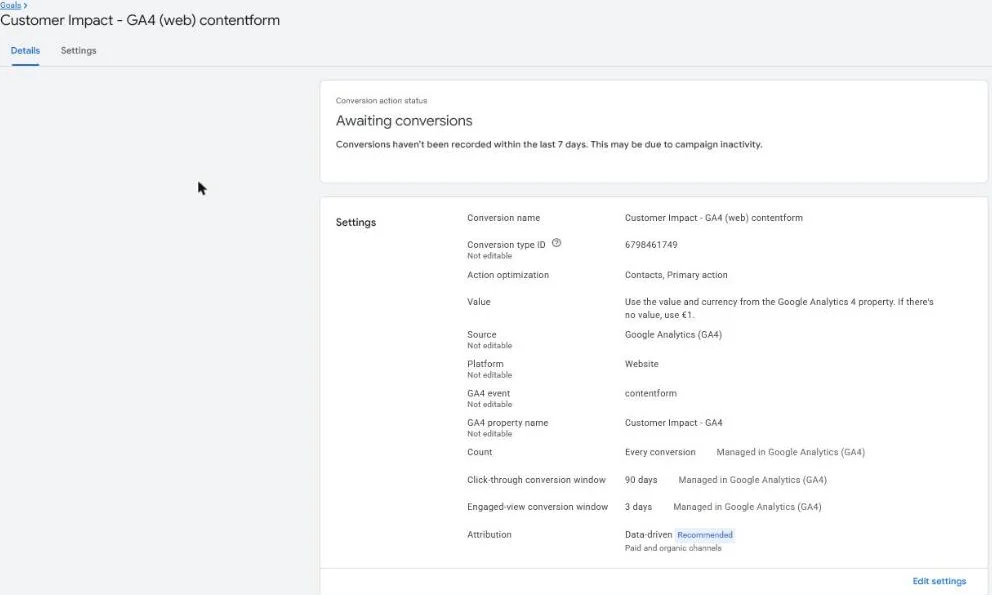 A conversion action in our own Google Ads account, October 2026: data-driven attribution and a 90-day click-through window. First touch isn’t an option.
So store the first touch in your CRM. Then send closed deals back with offline conversion imports, which match each sale to the ad click through its GCLID.
Our guide on setting up CRM lead management shows how to lay that foundation.
From reporting chore to growth lever
Once you see per channel how much pipeline and revenue it produces, you stop deciding budgets on gut feel.
You stop paying for leads that go nowhere. And you double down on what signs.
Running an account-based programme? You measure something slightly different: see ABM measurement: the KPIs and the reporting model that convinces your management.
For everything else, deal-level data decides.
Which three KPIs can you steer on tomorrow?
Lead-to-SQL, SQL-to-deal and cost per customer per channel. You don’t need 30 metrics, just these 3.
Each one answers a different question:
- Lead-to-SQL ratio: are you attracting the right people?
- SQL-to-deal ratio: do sales and marketing mean the same lead?
- Cost per customer per channel: where does your budget work hardest?
Together they tell you more than any vanity dashboard.
Why these three force alignment
You can’t calculate them without a working chain from lead to deal. So they tie your lead process and your sales process together.
That’s where the gain sits. Lead generation isn’t a separate tap, but the capture layer of one growth engine.
For the bigger picture, read our pillar on what lead generation is.
It shows how measuring, qualifying and converting form one system.
So which numbers should run your lead generation?
A handful of pipeline KPIs, with the vanity numbers pushed down to diagnostics.
A full dashboard feels productive, but it often measures how busy you are, not how fast you grow.
Steer on lead-to-SQL, SQL-to-deal and cost per customer per channel, and you optimise for pipeline instead of a pretty report.
Want your channels compared at deal level? Get in touch and we’ll build a KPI framework with you that steers on pipeline.
Free website scan
Enter your website and get an automatic scan within minutes, with concrete technical and SEO improvements. No sales pitch.
We only use your details for your scan. No spam, unsubscribe anytime.